Monitoring
info
Make sure you have followed configure hosts before continuing.
Gin-Nextjs stack uses Prometheus to collect monitoring metrics and Grafana to visualize them. After creating your application, you can use hln metrics [appName] command to see the dashboards of your application.
hln metrics gin-next-app
The output looks like this:
Use this cridential to login the monitoring dashboards of gin-next-app:
  Username: admin
  Password: prom-operator

Application gin-next-app has 1 available dashboard(s):
NAME                    URL
Gin Application Metric  http://grafana.h8r.site/d/FDB061FMz/gin-application-metrics
The dashboards of your application will be listed, as well as the cridentials. You can open them in your browser and login with the cridentials.
Here we get a Gin Application Metric dashboard, which shows the monitoring metrics of the gin-next-app's backend service. It's url is http://grafana.h8r.site/d/FDB061FMz/gin-application-metrics. Open it and you can see the following dashboard:
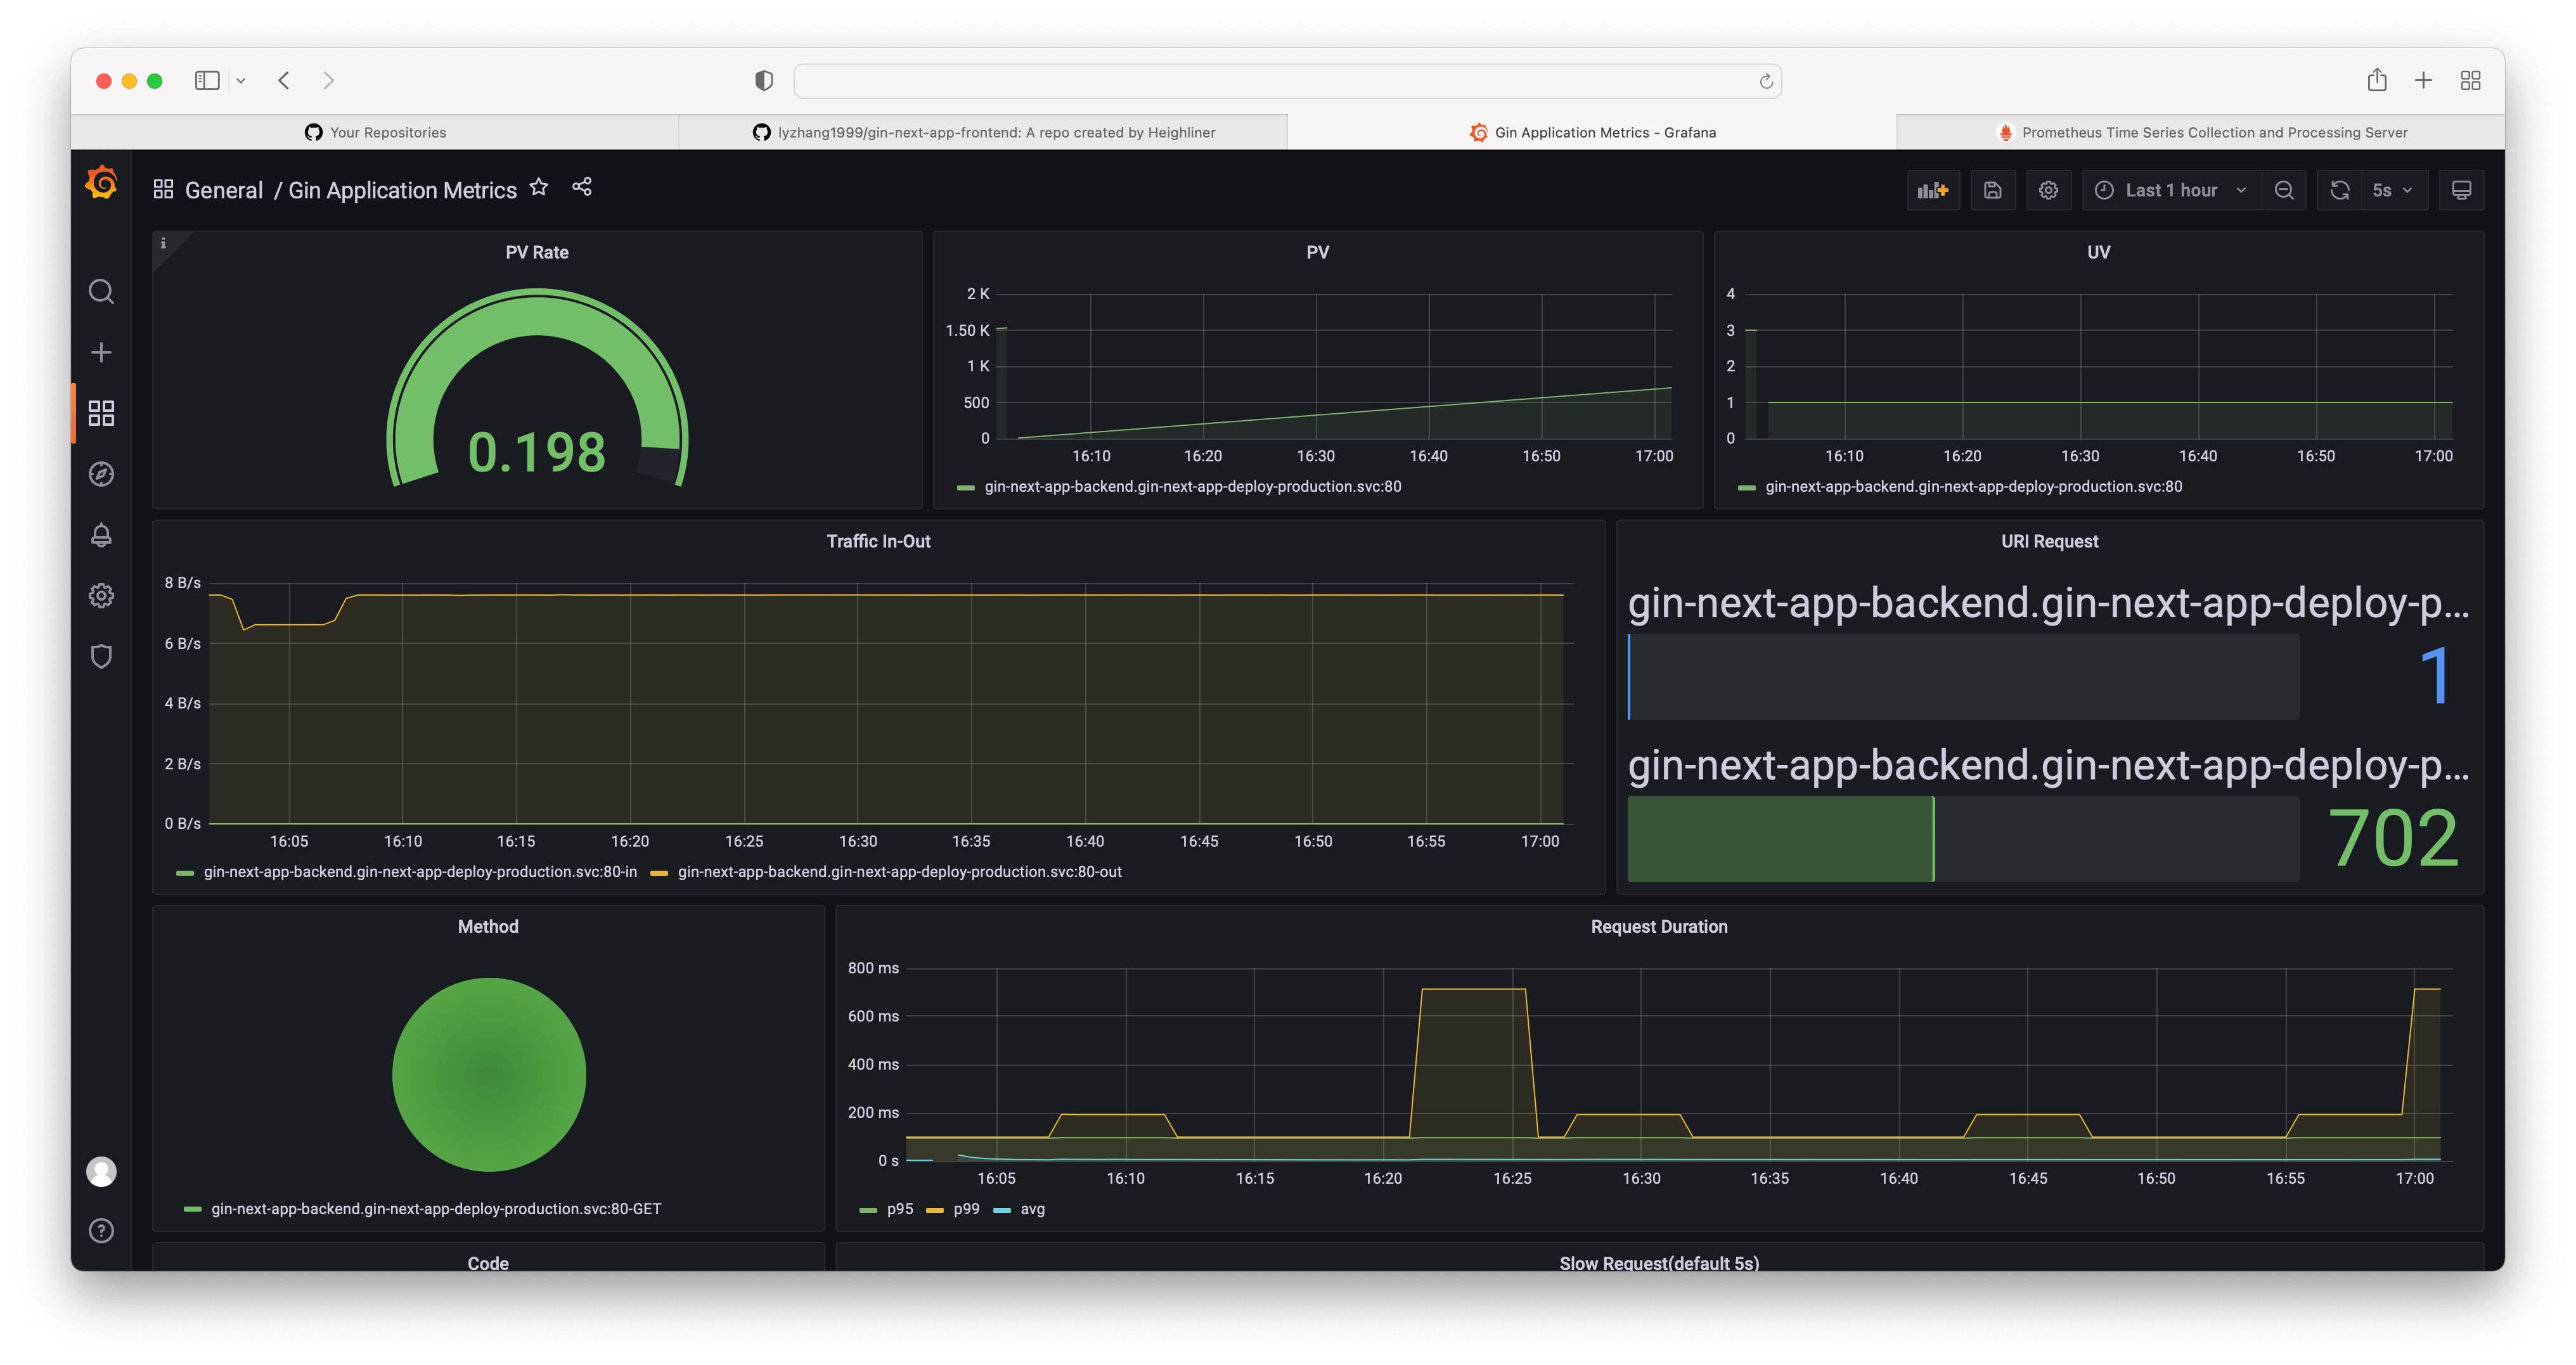
This dashboard displays our gin backend service's PV(Page View) and UV(Unique Visitor), URI Request count and much more. Click the Search dashboards tab(magnifying glass) and there are some other dashboards you can choose.
You can also access Prometheus at: prometheus.h8r.site
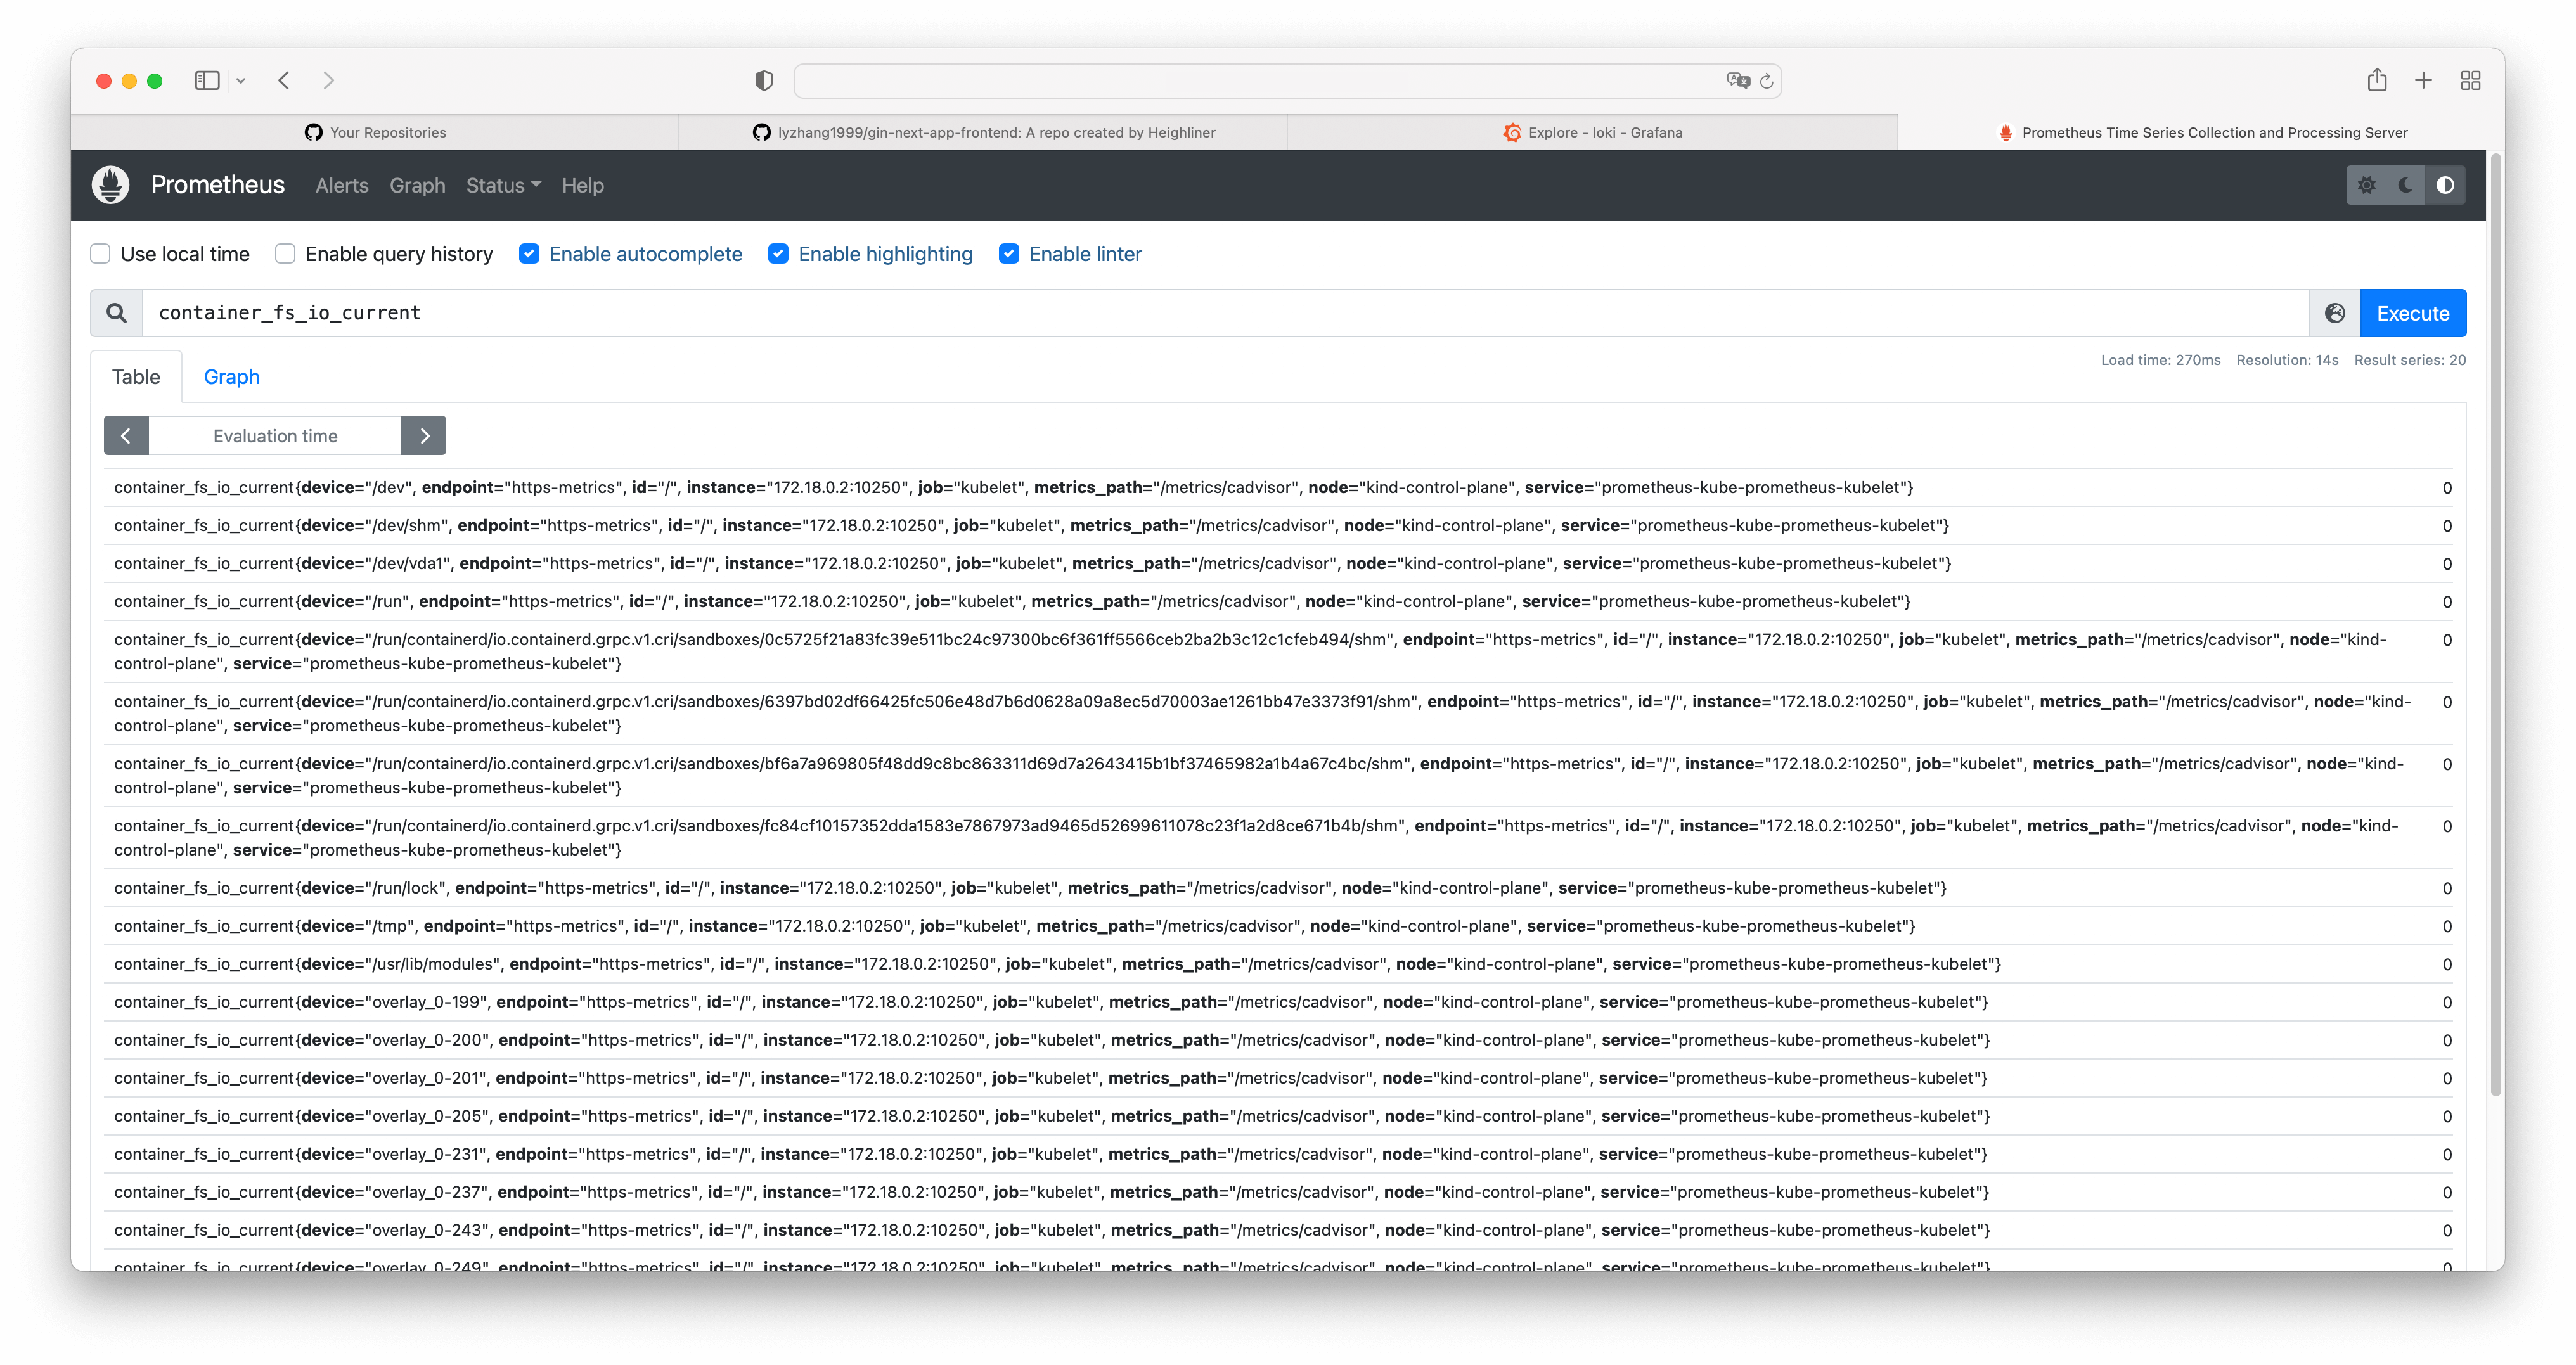
You can check and debug the configuration of prometheus there.
