Observability
Your app created via Heighliner stacks will have observability setup. By default, we use Prometheus to collect metrics, Grafana to display dashboards, and pipe logs from Kubernetes pods.
Logs
In Heighliner, a stack will normally create services and pods for an application.
You can get the logs of an application via hln logs <app> command.
hln will automatically list all options to let you select from.
Once you have selected a target, hln will pipe the logs from Kubernetes pods, and then display in console.
Note that K8s logs are not long term storage -- it will last for like 10days.
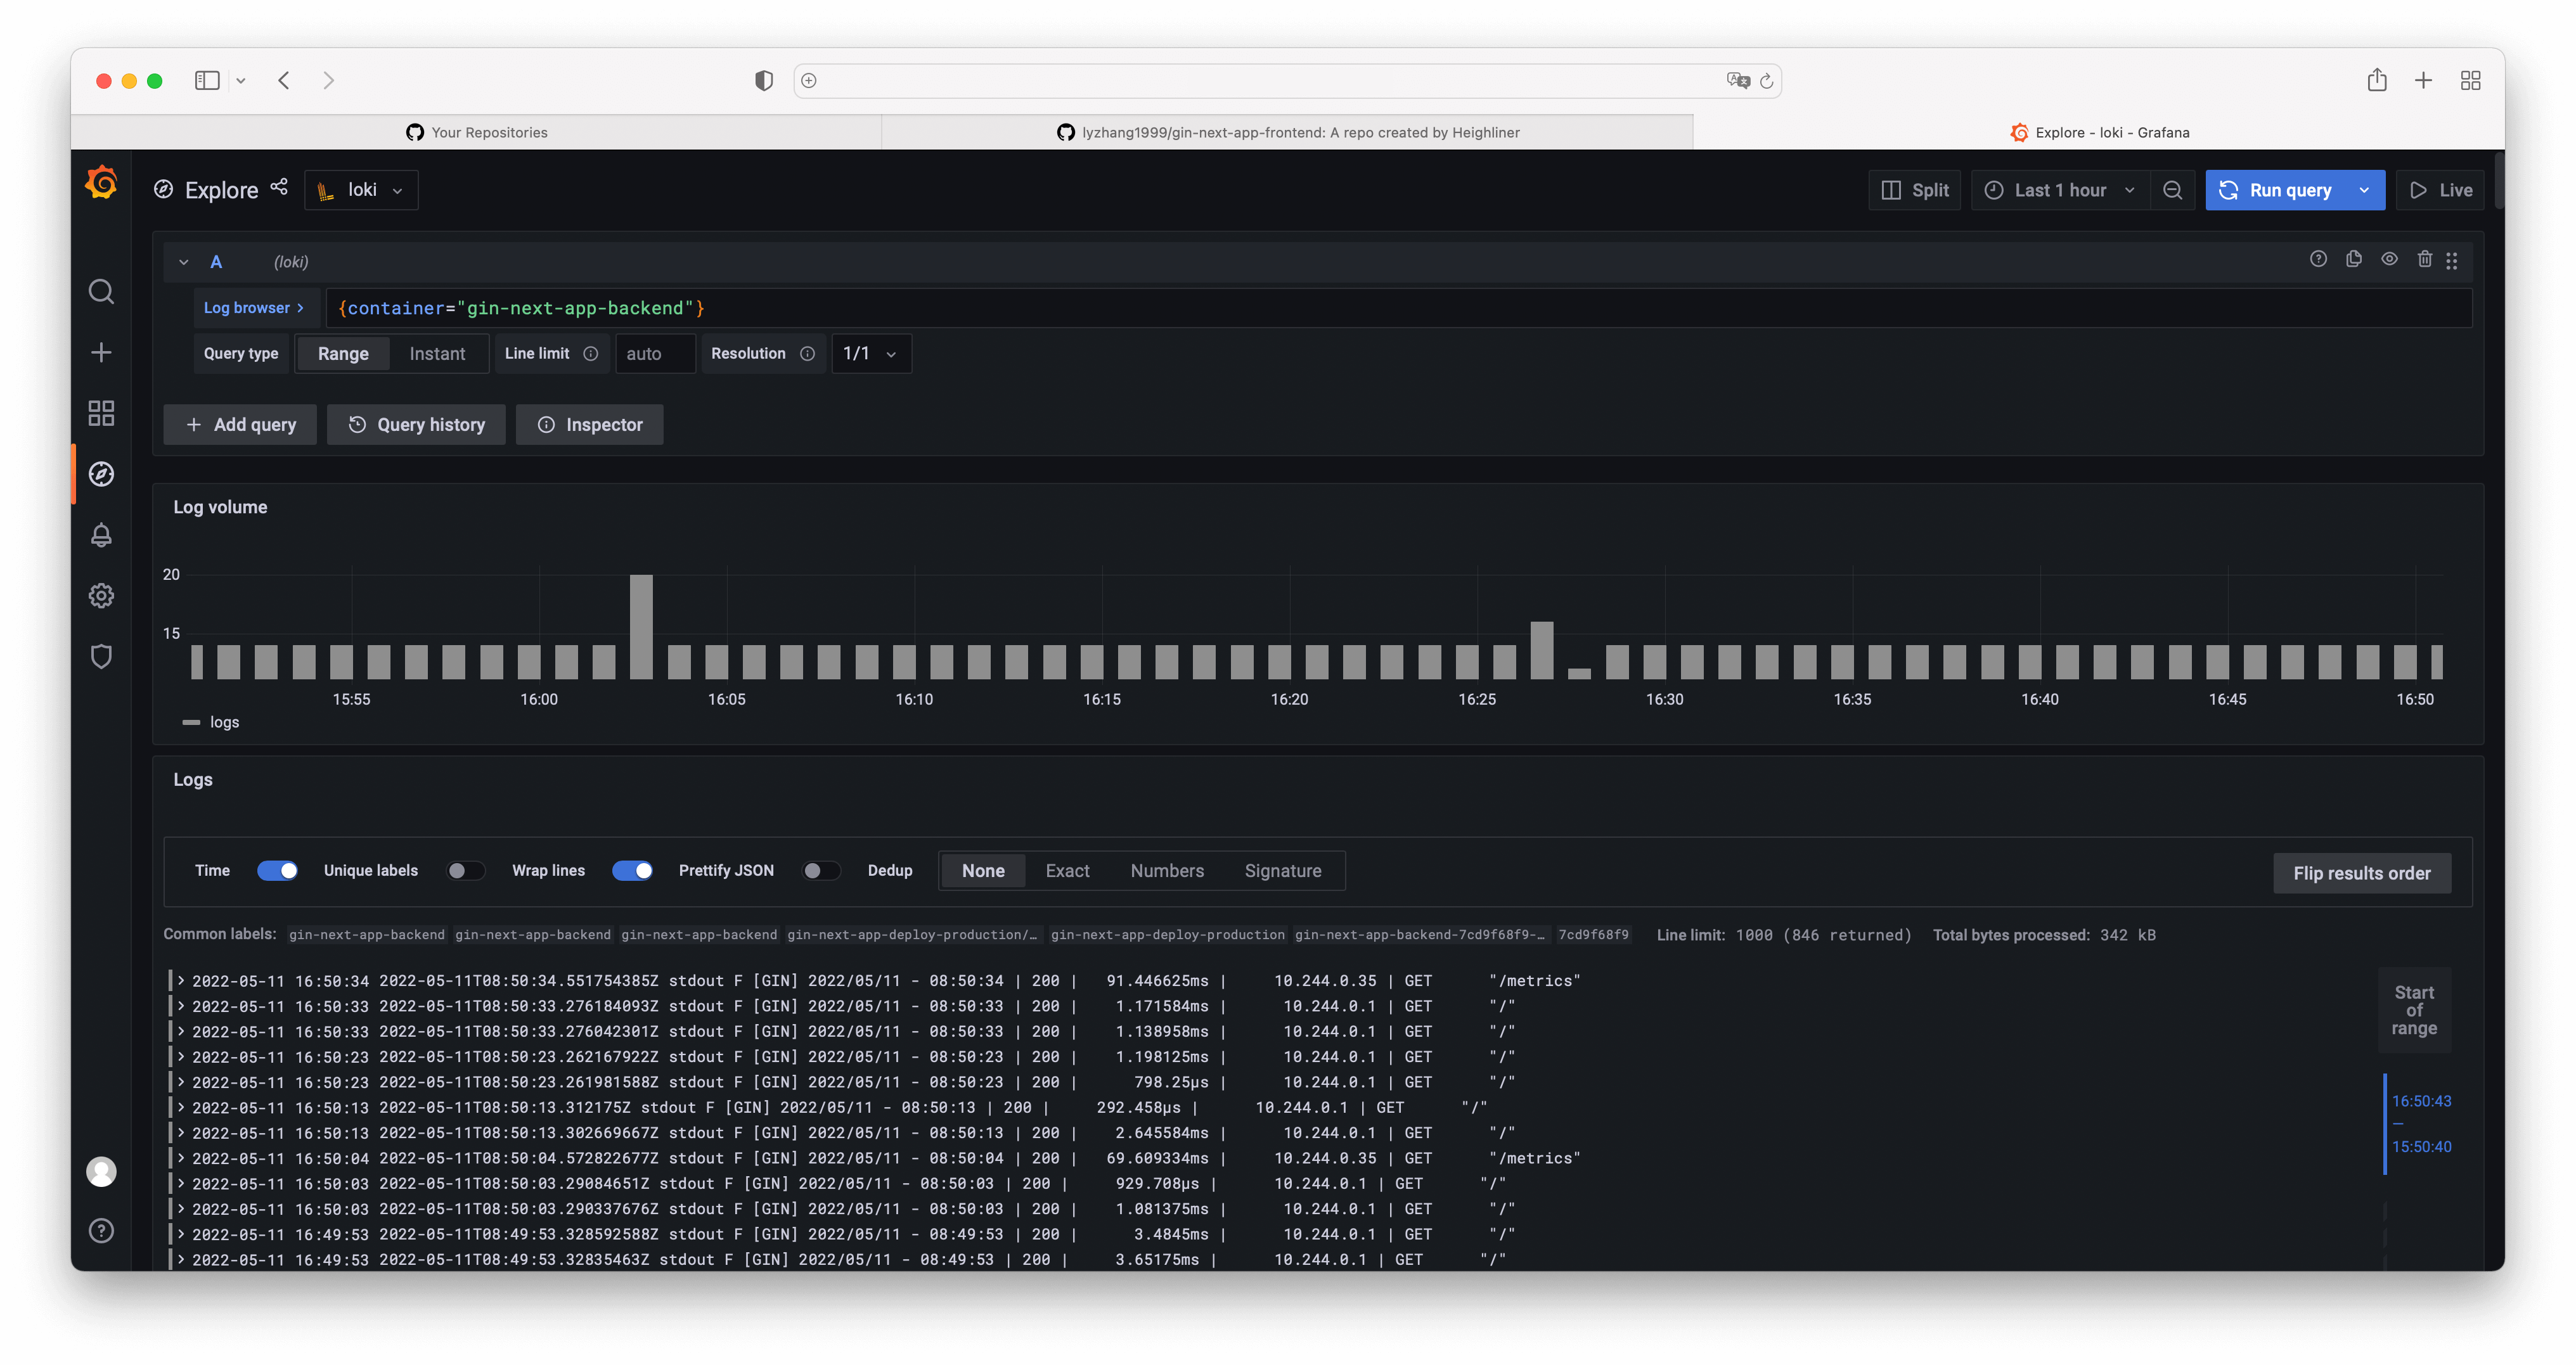
We also integrate with Loki and provide long term storage for logs.
You can get the Grafana dashboard url via hln status <app> command.
Then go into Grafana dashboard to access Loki:
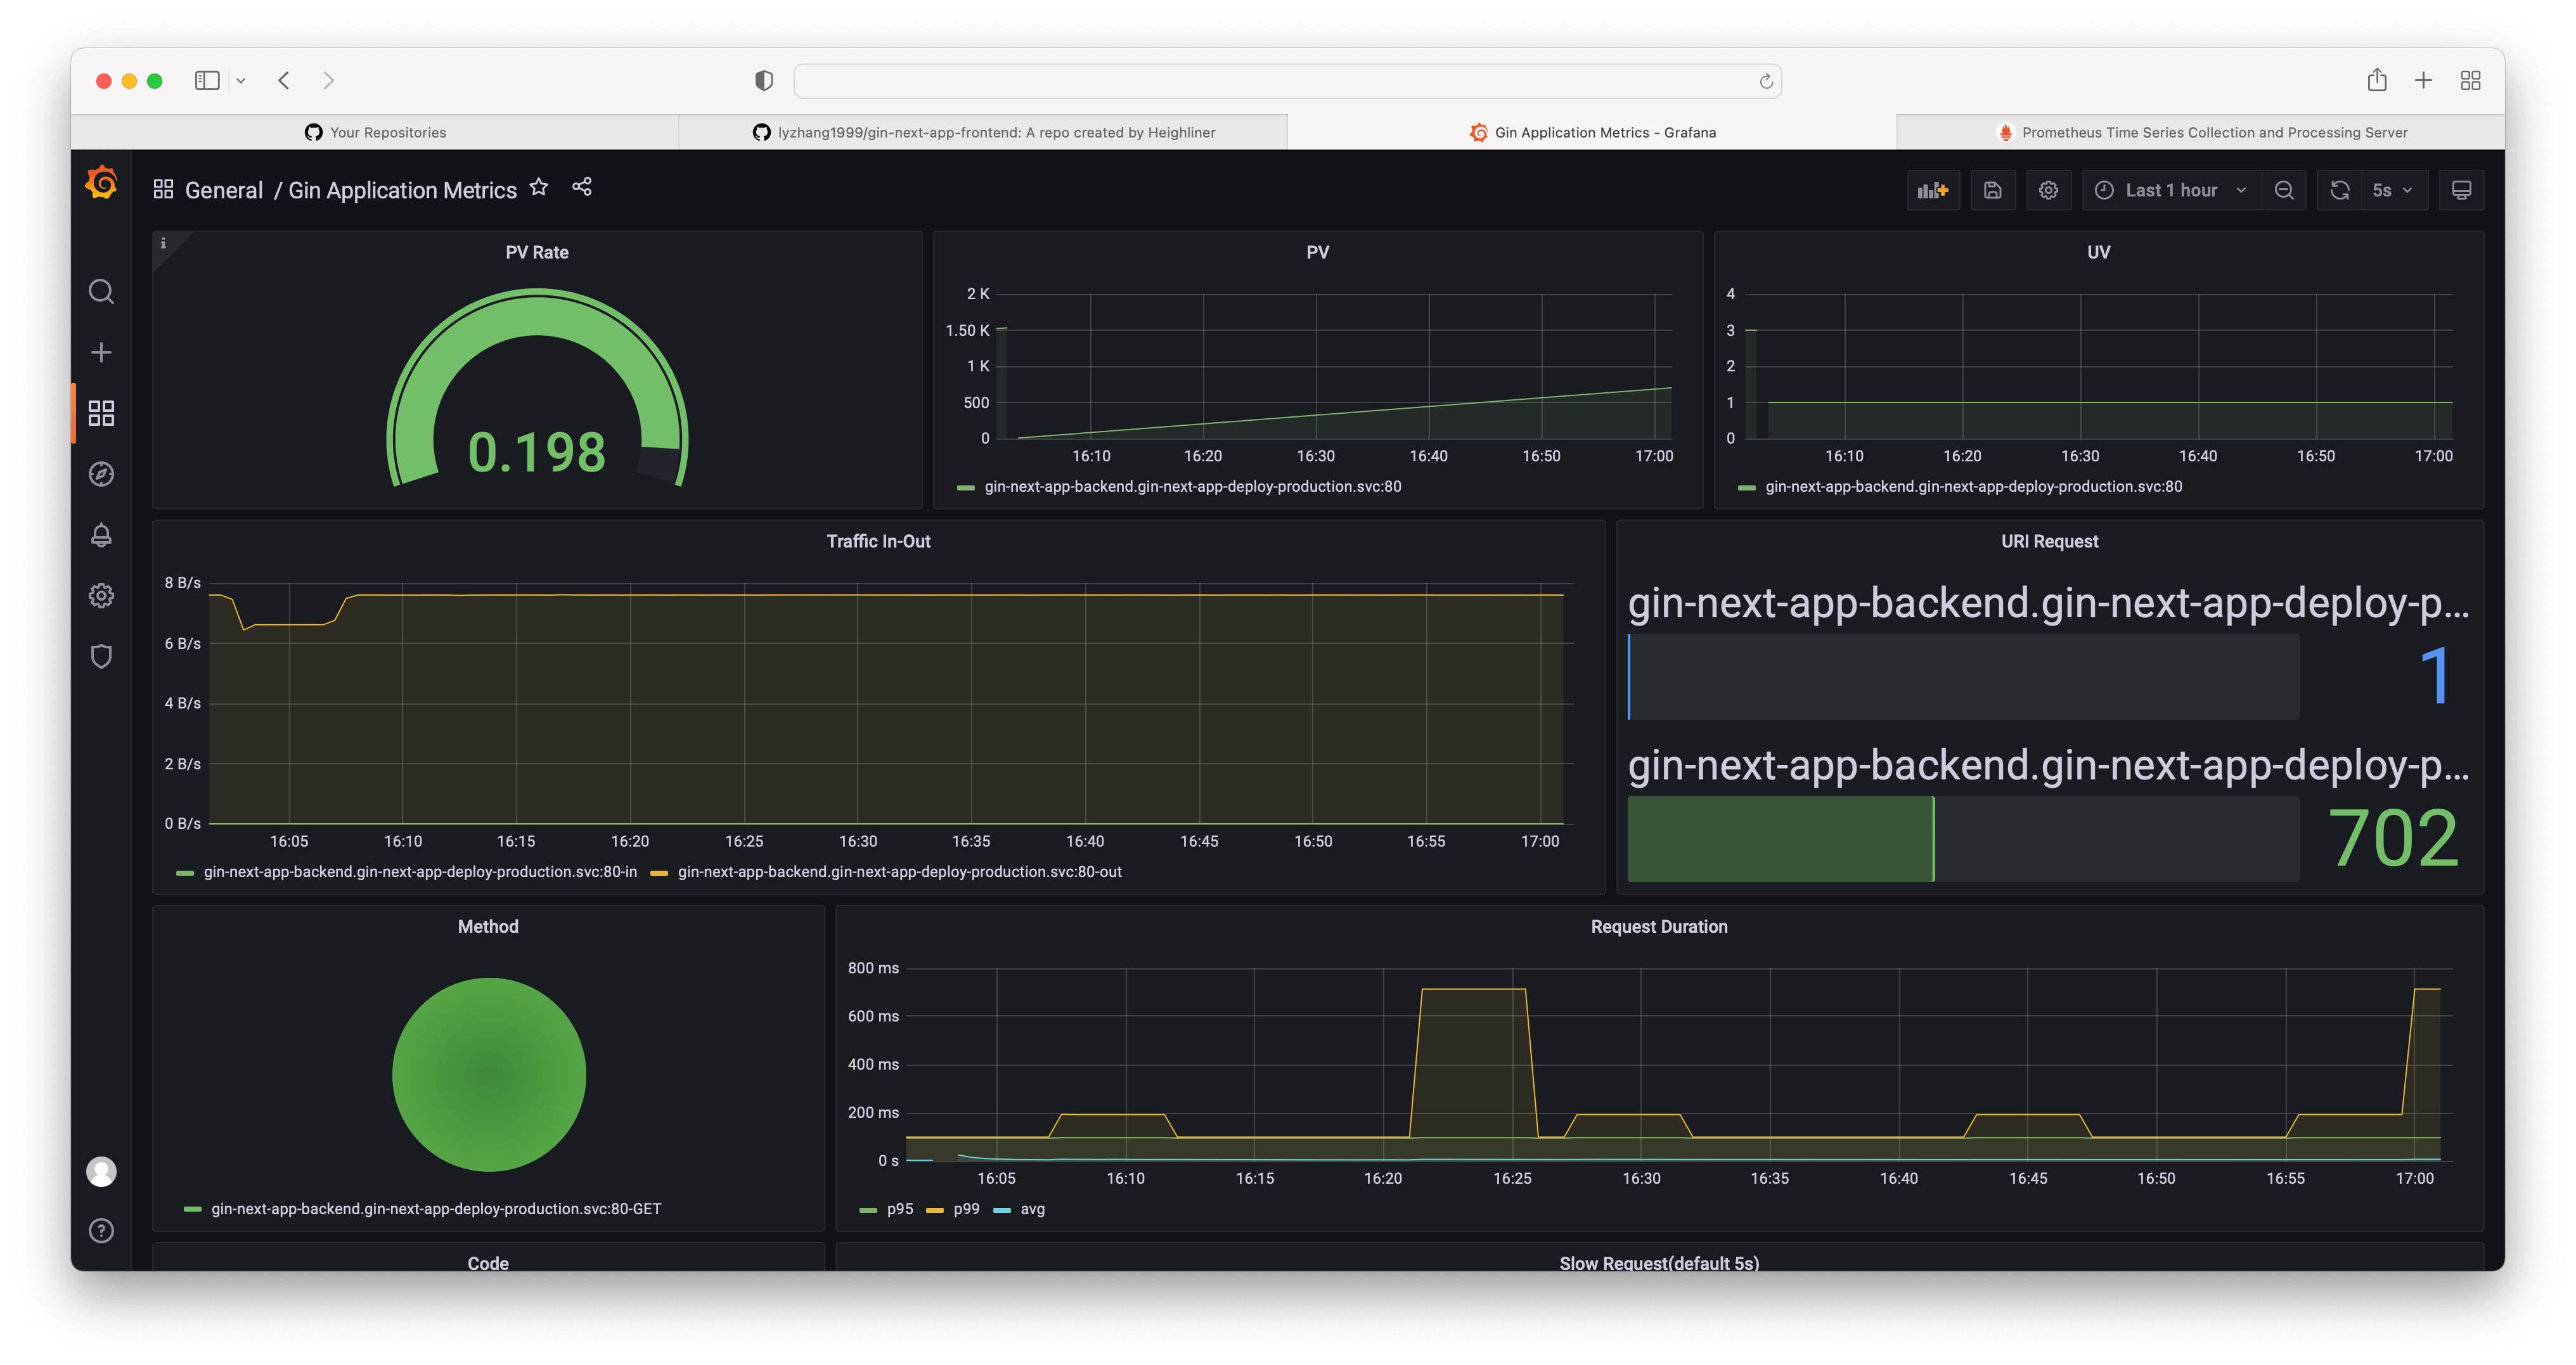
Grafana
In Heighliner, a stack will normally create services that export metrics and a Prometheus instance to collect metrics.
Then the metrics will be displayed in Grafana.
You can get the Grafana dashboard url via hln status <app> command.
Note that most stacks will create app-centric dashboards for each application.
For example, spring framework will export HTTP related metrics by default.
You can get the specific app-centric dashboard url via hln metrics <app> command.